Frappé Charts
GitHub-inspired simple and modern charts for the web
with zero dependencies.
Click or use arrow keys to navigate data points
Create a chart
Install
npm install frappe-chartsAnd include it in your project
import Chart from "frappe-charts/dist/frappe-charts.min.esm"... or include it directly in your HTML
<script src="https://unpkg.com/frappe-charts@0.0.3/dist/frappe-charts.min.iife.js"></script>Make a new Chart
  <!--HTML-->
  <div id="chart"></div>
// Javascript
let data = {
labels: ["12am-3am", "3am-6am", "6am-9am", "9am-12pm",
"12pm-3pm", "3pm-6pm", "6pm-9pm", "9pm-12am"],
datasets: [
{
title: "Some Data", color: "light-blue",
values: [25, 40, 30, 35, 8, 52, 17, -4]
},
{
title: "Another Set", color: "violet",
values: [25, 50, -10, 15, 18, 32, 27, 14]
},
{
title: "Yet Another", color: "blue",
values: [15, 20, -3, -15, 58, 12, -17, 37]
}
]
};
let chart = new Chart({
parent: "#chart", // or a DOM element
title: "My Awesome Chart",
data: data,
type: 'bar', // or 'line', 'scatter', 'pie', 'percentage'
height: 250
}); // colors: 'green', 'blue', 'violet', 'red', 'orange',
// 'yellow', 'light-blue', 'light-green', 'purple',
// 'magenta', 'grey', 'dark-grey'Update Values
  // Update entire datasets
  chart.update_values(
    [
      {values: new_dataset_1_values},
      {values: new_dataset_2_values}
    ],
    new_labels
  );

  // Add a new data point
  chart.add_data_point(
    [new_value_1, new_value_2],
    new_label,
    index // defaults to last index
  );

  // Remove a data point
chart.remove_data_point(index); ...
// Include specific Y values in input data to be displayed as lines
// (before passing data to a new chart):
data.specific_values = [
{
title: "Altitude",
line_type: "dashed", // or "solid"
value: 38
}
]
...Plot Trends
  ...
    x_axis_mode: 'tick',  // for short label ticks
                          // or 'span' for long spanning vertical axis lines
    y_axis_mode: 'span',  // for long horizontal lines, or 'tick'
    is_series: 1,         // to allow for skipping of X values
... ...
type: 'line', // Line Chart specific properties:
show_dots: 0, // Show data points on the line; default 1
heatline: 1, // Show a value-wise line gradient; default 0
region_fill: 1, // Fill the area under the graph; default 0
...Listen to state change
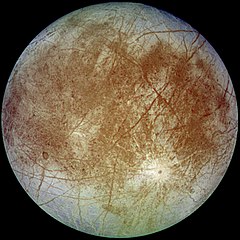
Europa
Semi-major-axis: 671034 km
Mass: 4800000 x 10^16 kg
Diameter: 3121.6 km
  ...
    type: 'bar',     // Bar Chart specific properties:
    is_navigable: 1, // Navigate across bars; default 0
  ...

  chart.parent.addEventListener('data-select', (e) => {
    update_moon_data(e.index); // e contains index and value of current datapoint
  });
Simple Aggregations
  chart.show_sums();  // and `hide_sums()`

  chart.show_averages();  // and `hide_averages()`
And an Annual Heatmap
  let heatmap = new Chart({
    parent: "#heatmap",
    data: heatmap_data,  // object with date/timestamp-value pairs
    type: 'heatmap',
    height: 115,
    discrete_domains: 1  // default 0
  });