
You can not select more than 25 topics
Topics must start with a letter or number, can include dashes ('-') and can be up to 35 characters long.
 pratu16x7
e1e7e7fd35
pratu16x7
e1e7e7fd35
|
7 年之前 | |
|---|---|---|
| dist | 7 年之前 | |
| docs | 7 年之前 | |
| src | 7 年之前 | |
| .babelrc | 7 年之前 | |
| .eslintrc.json | 7 年之前 | |
| .gitignore | 7 年之前 | |
| LICENSE | 7 年之前 | |
| README.md | 7 年之前 | |
| package-lock.json | 7 年之前 | |
| package.json | 7 年之前 | |
| rollup.config.js | 7 年之前 | |
README.md

More information at the website: https://frappe.github.io/charts
Usage
Install
npm install frappe-charts
Include it in your html:
<script src="frappe-charts.min.js"></script>
Make a new Chart:
let data = {
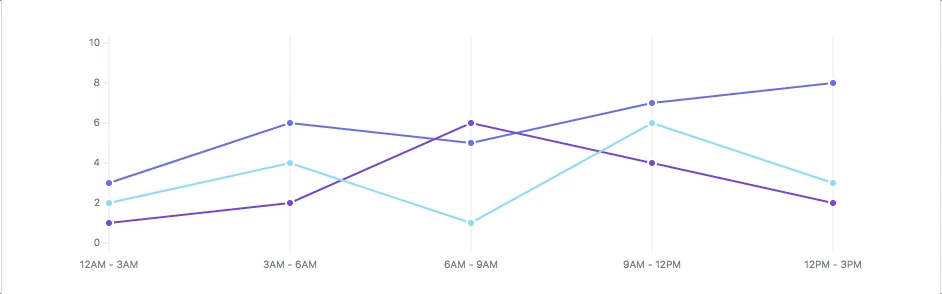
labels: ["12am-3am", "3am-6am", "6am-9am", "9am-12pm",
"12pm-3pm", "3pm-6pm", "6pm-9pm", "9pm-12am"],
datasets: [
{
title: "Some Data", color: "light-blue",
values: [25, 40, 30, 35, 8, 52, 17, -4]
},
{
title: "Another Set", color: "violet",
values: [25, 50, -10, 15, 18, 32, 27, 14]
}
]
};
let chart = new Chart({
parent: "#chart",
title: "My Awesome Chart",
data: data,
type: 'bar', // or 'line', 'scatter', 'percentage'
height: 250
});
If you want to contribute:
- Clone this repo.
cdinto project directorynpm installnpm run dev
License: MIT